L = VƔ
where Ɣ, the Greek letter gamma, represents gamma.
The originators of video images normally assume their images will be displayed on TVs that have a standard gamma of 2.2 — or, at most, 2.5. If the TV's gamma is too high, the image will be too dark — especially the darker portions of the image. But if gamma is too low, the image will appear washed out.
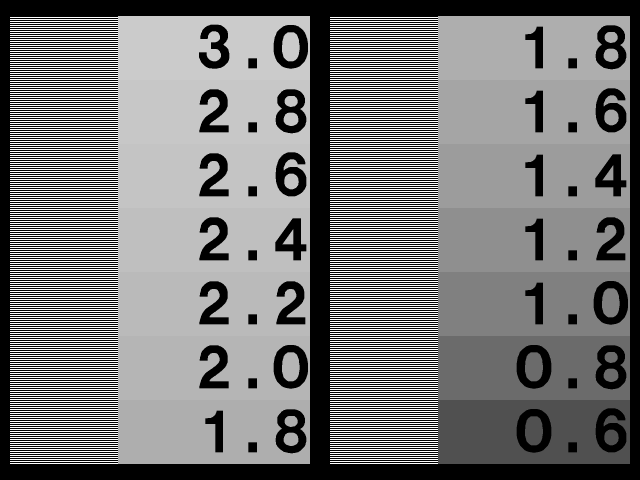
Gamma is nominally a constant that does not vary over the range of V, the possible brightness levels of the image's pixels. When that is the case, test patterns like this "Gamma Chart" from Ovation Multimedia's Avia: Guide to Home Theater calibration DVD can be used to measure the gamma of a TV:

(Click on the image to bring up a larger version.)
This chart sets nine squares of various levels of gray against a background which, when viewed at a distance or with a squint, blends pure white and pure black in 50-50 proportions. That yields a 50% gray. The grays in the patches are nominally much lighter than 50% gray, but the gamma of the display acts to darken them. The label of the square which, when duly gamma-darkened, matches the 50% gray of the blended background gives the value of the display's gamma. (You may have to interpolate between two squares if gamma is odd — say, 1.9 or 2.3.)
Another gamma test pattern may be found here:
This one seems to give like results. But I find that there are several caveats that need to be kept in mind when trying to determine gamma using charts like these. For example, they don't necessarily work right if I display them on my TV screen via an S-video connection from my laptop, an older Mac PowerBook.
This computer does not have a video card per se. All it has is an external monitor connection and an S-video connection. When I hook the computer to my plasma TV via an S-video cable and play the Avia Gamma Chart test pattern into the TV via the DVD Player software on my Mac, I seem to get a gamma reading that is way too low.
What the exact gamma measurement is is hard to say. When I play the Avia Gamma Chart through the laptop's DVD Player software into the TV, the squares in the pattern are so light gray that gamma 1.6 has to be far too high.
When I play the screen snap I have taken of the Avia Gamma Chart into the TV via the Preview app, I seem to get somewhat darker squares and a gamma reading that is only slightly less than the lowest on the chart, 1.6.
When I play the same screen snap via the Firefox browser, the squares get lighter, but not as light as with DVD Player.
When I play the second test pattern shown above via Preview, it seems to say my TV has a gamma of 1.0 (!).
When I play that second test pattern via Firefox, gamma seems to read a smidgen above 0.8 (!).
Those low readings can't be anywhere near correct! Can they????
The issue is confused by several factors. One is that Macs use so-called ColorSync "display profiles" to tailor their screen images. These profiles involve, among other things, a target gamma setting. I can make different profiles that have different target gammas, and whichever one I make active will control all screen output ... with certain exceptions!
One exception seems to be that (on my laptop but not on my desktop iMac, for whatever reason) the display profile is ignored by the DVD Player software.
Another exception seems to be that when I use an external TV to "mirror" the screen of my laptop via an S-video hookup, the display profile does not affect the external TV.
Also confusing the issue is the fact that in various of the above scenarios the Avia Gamma Chart has to be scaled to fit a certain window size or screen resolution. It doesn't scale well: the supposedly equal-width horizontal lines of alternating black and white show up with different scaled widths, resulting at best in a regular oscillation of the blended background intensity and at worst in irregular spacings that shoot the blending all to hell.
The problem seems not to affect the second test pattern, whose lines are closer together. But it's anybody's guess how accurate it is in my situation. There are just too many X factors between it and my TV screen.
After I wrote the above it occurred to me that I was missing a bet. I suddenly realized that I might be able to use the same Apple Display Calibrator software which makes display profiles for my laptop computer's internal screen to make one for my Hitachi plasma.
This application opens from within the Mac'sSystem Preferences: Displays control panel when I click on the Color tab. I hadn't quite realized at first that Display Calibrator opens two windows, one for the built-in display of my PowerBook and another for the television connected via an S-video cable. When I select the Color tab in that second window, I find myself in Display Calibrator making a display profile for my plasma TV!
The process involves setting the TV's contrast to maximum (100/100) and its brightness to a level (40/100) where a dark gray apple in the middle of a darker gray square is just visible. Then there are five steps involving adjusting a vertical slider until an apple in the middle of a similar gray square perfectly matches the square in lightness. Each time, the apple and the square are at different intensity-level pairs, the result being that the Display Calibrator measures the gamma of the display at five points along the entire brightness gamut.
There is also, in each of the same five panels, a horizontal/vertical slider that adjusts the apple's chromaticity coordinates for a neutral gray. I didn't have to touch the chromaticity sliders at all.
So the succession of five interactive panels can be thought of as "gamma+chromaticity" measurements. After going through them, I was presented with a panel that let me set the target gamma that I wished to achieve. I could choose any gamma from 1.0 up to ... well, I don't remember how high the slider went. I could also click on TV Standard 2.2 or PC Standard 2.5 or even Linear 1.0, or I could check "Use Native Gamma" (which is what I did) to accept the native gamma of the TV.
Next came a panel that let me set the TV's target white point. Again, I opted for the native white point that had just been measured.
After a couple of further administrative steps, I was finally presented with a profile summary which told me that my native gamma was 1.03 (!) and my native white point was 6507K.
These chromaticity coordinates, which relate to those on the 1931 CIE chromaticity diagram, were also reported:
| x | y | |
| Red phosphor: | 0.630 | 0.340 |
| Green phosphor: | 0.295 | 0.605 |
| Blue phosphor: | 0.155 | 0.077 |
| Native white point: | 0.313 | 0.329 |
That was with the "Standard" color temperature selected on the TV, by the way. With another setting I expect I may have gotten different chromaticity coordinates, at least for the white point.
The real scoop here is that the Hitachi's "native gamma" was a supposedly near-linear 1.03. In fact, I was unable to adjust a couple of the panels' gamma sliders far enough downward to get the magic apple-in-the-square to fully disappear, and I suspect had I been able to do so I might have read a native gamma of 1.0!
This made little sense to me, as a native gamma of 1.0 or thereabouts would seemingly make for a very washed-out picture. So I decided to investigate further by obtaining a shareware monitor calibrator for the Mac, SuperCal.
SuperCal does what Display Calibrator does, but with a more elaborate user interface. I won't attempt to describe all the steps needed to calibrate a monitor, but the steps that actually determine gamma are of some interest. They involve adjusting a slider until the top and bottom halves of a colored square set against a black background appear to be of equal brightness.
You do this several times for each of the three primary colors, red, green, and blue. Each time, you adjust another slider so that the adjustment you are presently making is for a different video level along the possible gamut from black to maximum intensity. As you make these adjustments, a graph inset in one corner of the screen shows you the actual gamma curve you are creating, point by point!
That's what gave me the insight I needed to figure out what was really going on.
For the graph is actually a gamma-correction graph. It shows the inverse of the gamma curve of the monitor, not the monitor's gamma curve per se. For example, if the gamma of the monitor happens to be 2.2, the graph shows
L = V(1/2.2)
The rationale? What is actually being determined by SuperCal is what gamma-correction curve is needed in order to exactly neutralize the inherent gamma of the monitor.
Once it knows that, it can go on to produce a ColorSync profile for regular use with that monitor. In creating this profile, SuperCal lets the user decide which "target gamma" to use. For instance, the user may select a target gamma of 2.5, such that anything that appears henceforth on the monitor screen looks like it would on a Windows PC, where the usual gamma is 2.5.
In effect, SuperCal first neutralises the "native gamma" of the monitor, and then it simulates whatever "target gamma" the user opts for.
It occurred to me that I might expect SuperCal to show me a triad of gamma-correction curves, one for each primary color, that were absolutely linear, if I were to use it and not Display Calibrator to calibrate my Hitachi plasma, while it is hooked to my laptop via S-video.
Unlike the usual case in which the monitor's gamma-correction curve humps upward away from the slope-1.0 diagonal of the graph, I would expect it to hug that diagonal slavishly — if, that is, my earlier experiments were correct, and the "native gamma" of the Hitachi is indeed 1.0.
And that's exactly what happened. In each case, the red, green, or blue gamma-correction plot SuperCal showed me was a ruler-straight line coincident with the slope-1.0 diagonal of the graph.
All of which brought home to me what I said above: the SuperCal and Display Calibrator are in the business of measuring a monitor's native gamma so that they can neutralize it with the appropriate gamma-correction curve and then (optionally) replace it with the target gamma of the user's choice.
Once my thinking about the above became clear, it next occurred to me that the "native gamma" of my Hitachi plasma was reading at 1.0, or linear, in my Mac-to-Hitachi S-video scenario because something else on the Mac is already gamma-correcting the signal.
That is, there appears to be an independent software or hardware gamma-correction function built into the Mac's S-video-out signal path. Since this path "knows" the target monitor is a television receiver, it perhaps uses the inverse of the TV-standard gamma, 2.2, as the exponent of its signal-transformation function:
L = V(1/2.2)
That's a guess as to the particular inverse exponent it uses, of course. But whatever the actual exponent, it appears to be one that exactly inverts the true native gamma of my Hitachi. If it were not, then SuperCal would surely show me gamma-correction plots that do not precisely hug the slope-1.0 diagonal!
So I have to conclude that, although I don't yet know the actual true native gamma of my Hitachi plasma, I do know that (a) it matches what the Mac "expects" any television it feeds at its S-video output to have(possibly 2.2) and (b) it is, as it should be, constant over the video brightness range (or SuperCal could not show me a straight slope-1.0 gamma-correction function).
No comments:
Post a Comment